Release notes
Current version is phy v2.0b1 (beta 1) (7 Feb 2020).
New views
-
Cluster scatter view: a scatter plot of all clusters, on two user-defined dimensions (for example, depth vs firing rate). The marker size and colors can also depend on two additional user-defined dimensions.

-
Raster view: spike trains of all clusters

-
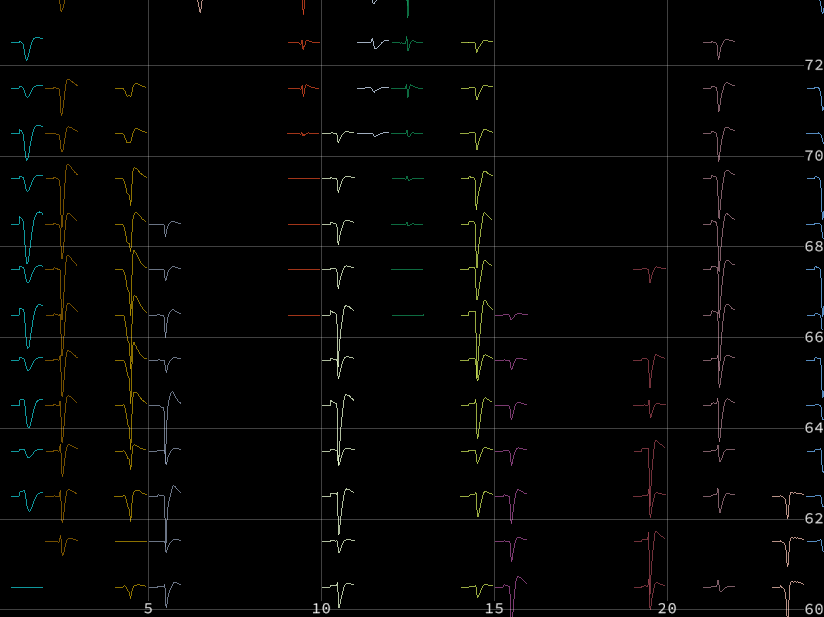
Template view: template waveforms of all clusters

-
Cluster statistics views (histograms):
- ISI
- Instantaneous firing rate
- Write your own as a plugin

-
Spike attributes views: a scatter view is automatically created for every
spike_somename.npycontaining 1D or 2D values per spike
-
Trace image view: a minimal trace view that shows a large textured image
(n_channels, n_samples)instead of multiple polylines.
-
Improved Amplitude view: different types of spike amplitudes as a function of time, with histograms.

-
IPython view: interact with the GUI and the data programmatically.

New features
- Split clusters in the amplitude view or in the template feature view, in addition to the feature view
- Cluster view:
- Dynamically filter the list of clusters based on cluster metrics and labels (using JavaScript syntax)
- Snippets to quickly sort and filter clusters
- New default columns: mean firing rate, and template waveform amplitude
- The styling can be customized with CSS in a plugin (see plugin examples in the documentation)
- Amplitude view:
- Show an histogram of amplitudes overlayed with the amplitudes
- Support for multiple types of amplitudes (template waveform amplitude, raw waveform amplitude, feature amplitude)
- Splitting is supported
- Alt+click in the amplitude view to center the trace view to a certain time (position shown with the vertical yellow bar)
- Show the time interval currenty displayed in the trace view as a vertical yellow bar
- Correlogram view:
- Horizontal line for the baseline firing rate
- Customizable vertical line for the refractory period
- Waveform view:
- Change the number of waveforms directly from the GUI
- Higher-quality thicker mean and template waveforms
- Feature view:
- One can now change the specification of the subplots in a plugin
- All views:
- Add multiple views of the same type
- Closable views
- View menu
- Toggle automatic update of views upon cluster selection
- Easily take screenshots of individual views
- Control bar at the top of every view, with customizable text and buttons (screenshot, toggle auto update, etc.)
- Axes (in most views)
- Higher-quality text with OpenGL
- Control+wheel to change the scaling (in most views)
- Alt+wheel to change the marker size
- Change the number of "best" channels in the user configuration file
- Trace view:
- Auto-update by default
- Trace view, raster view, template view:
- Customizable color mapping for clusters based on any cluster metrics or labels
- Probe view:
- Channel labels
- Template model
- Support multiple raw data files (virtually concatenated)
- Support for multiple channel shanks: add a
channel_shanks.npyfile with shape(n_channels,), with the shank integer index of every channel.
Improvements
- A new file
cluster_info.tsvis automatically saved, containing all information from the cluster view. - Minimal high-level data access API in the Template Model
- Improved performance, avoid blocking the GUI when loading large amounts of data
- Fix scaling issues in waveform view
- More efficient probe view
- Slightly different gray colors for noise and MUA clusters in the cluster view
- Menu reorganization
- Toolbar with icons
- Bug fixes with cluster labels
- New
plugins/folder in the repository, with many plugin examples - Documentation rewritten from scratch, with many examples
Internal changes
- Support Python 3.7+, dropped Python 2.x support (reached End Of Life)
- Updated to PyQt5 from PyQt4, which is now unsupported
- Improved OpenGL-based plotting API (based on a fork of glumpy instead of vispy)
- Dropped the phy-contrib repository
- Created phylib, a small dependency with I/O code and non-graphical utilities, also used by ibllib
- Moved the phy GitHub repository from kwikteam to cortex-lab organization
Notes for plugin maintainers
The following changes may affect phy plugins:
- The
add_viewandview_actions_createdevents have been removed. - You should now use the new event
view_attached(view, gui)that is emitted when a view is attached to the GUI.
[coming soon] Upcoming features
- Support for events: PSTH view, trial-based raster plots, etc.
- More efficient GPU-based plotting